ROI Tracker
ROI: Return on Investment (ROI) is a common financial metric used to measure the likelihood of gaining a return from an investment. It’s often used to compare the efficiency of different investments
Step 1: Define Investments and Returns
Firstly, define your investments (your costs) and your returns. This could include costs such as labour, materials, training, and maintenance, while returns could include increased revenue, decreased costs, or improved productivity. It’s important to be as comprehensive as possible when defining these values.
Step 2: Check and Calculate ROI
ROI is calculated by subtracting the cost of the investment from the gain from the investment, then dividing the result by the cost of the investment, and finally multiplying it by 100 to get a percentage.
Step 3: Monitor Trends and take a decision
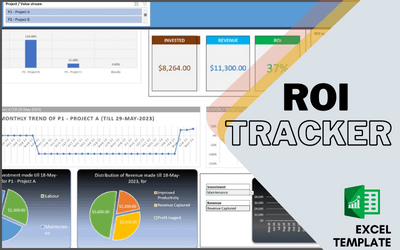
Monitor the trends of Revenue against Investment in multiple Dimension and take future decisions
| . Master | Define the Mast information like Projects/Value Streams, Investment Types, Expense Types This Slide is to create the Master list of all projects or value stream, Typical Expense types like Labour Cost, Materials cost, Training cost etc, there are options to create 50 different types of Expenses, similarly have option to create Master list for Returns for Example Revenue Captured, Productivity Increased, Profit from sale etc. These master list will be used to add transaction as on when the user will hit a expense or return. It also have an option to identify 3 favourite Projects or Value Stream |
| 2. Project Investment and Revenue | This slide for adding Expense and Return details, with Specific date, type of Expense if it’s a Expense, or type of returns if it is return |
| 3. ROI Till Date | This slide is to quicky Summarize the total Investment and Returns till date, and Calculate the ROI |
| 4. Analysis-Specific Duration | To drill down the above summarised data, user can navigate to next slide and filter on Specific Quarter with in last 3 years, or Months with in last three years. To get project with Investments or Returns for the selected time duration |
| 5. ROI-Dashboard | This is the slide to analyse the Investment and Returns with multiple different aspects like. 1. Project of Value Stream comparison on ROI There are options to filter on projects or a specific past date to get the data for based on the transaction captured till that day and for that Project. 2. Investment, revenue and ROI, till Selected Date 3. ROI Comparison for Favourite 3 Projects or Value Stream 4. Monthly Trend of Selected Project till selected Date 5. Quarterly Trend of Selected Project till selected Date 6. Breakdown of types of investment on Total Investment till that selected date and selected project 7. Breakdown of types of revenue on Total Investment till that selected date and selected project 8. Trend Analyse to month level of a specific Investment or revenue types 9. Quarterly Trend analysis of Selected Project with Comparison on Investment and Revenue 10. Monthly Trend analysis of Selected Project with Comparison on Investment and Revenue |
| 6. Investment and Revenue | Internal Data Management – Default is Hidden |
| 7. Monthly Trend Cumulative | Internal Data Management – Default is Hidden |
| 8. Quarterly Trend Cumulative | Internal Data Management – Default is Hidden |
| Number of Transaction allowed | 4000 |
| Number of Projects or Value Stream | 100 |
| Max Investment Types | 50 |
| Max Revenue Types | 50 |
| Number of Years in Past for Trend analysis | 3 years |
Q1. How Can I raise a Support Request ?
Option 1 – Raise a Support request
https://agiledigest.atlassian.net/servicedesk/customer/portal/1/group/2/create/10
Option 2 : email us at support@agiledigest.com
Q2. Does this have any Macros?
Yes, To refresh the Pivot table and graphs on change of key filter, If you don’t enable the content, you need to refresh the charts and tables manually
Q3. Can I change the formulas?
Yes you can, a precautionary measure is always to keep a copy, so that in case some problems appear, you can revert back to copied template
Q4. Can I change/delete Agile Digest Logos?
Yes, however, unauthorized copies or distribution outside your project for commercial purposes is strictly prohibited.
Video Tutorial
Download Brochure
Gallery


