SCRUM METRICS – EXCEL TEMPLATE
This Template is prepared to create and manage Scrum Metrics and KPI. See more details below.
Available Metrics
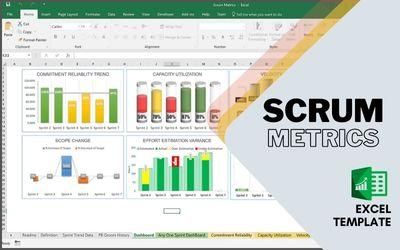
| 1 | Commitment Reliability | Shows the percentage of story points completed against its commitment for every sprint. With Trend record among last 6 completed sprints. |
| 2 | Capacity Utilization | Represent the team capacity in hours and committed hours for each sprint, measured in effort hours. With Trends among the last 6 sprints |
| 3 | Velocity | Represents a total number of story points completed each sprint, with trend analysis for the last 6 sprints. |
| 4 | Velocity Fluctuation | Represents the velocity variance from average with relation to max and min tolerance. |
| 5 | Scope Change | Sprint over Sprint, for Last 6 sprints, the amount of story points added to the sprint or amount of story points removed from the sprint, After Sprint Started. |
| 6 | Defect Leakage | Amount of Defects detected after development, You can calculate it as defects detected by the development team Vs Defects detected by the Product Owner / or UAT. |
| 7 | Effort Estimation Variance | Effort estimated Vs Actual shows Overestimation hours and underestimation hours |
| 8 | Backlog Health | Shows the health of backlog in as a total number of Story Points available in backlog Vs Average Velocity (last 6 months). The speedometer shows the current backlog health is below 1 time of Average Velocity, at least 1 time of Average velocity, at least 2 times of average velocity or more than 3 times of average velocity. |
Customization
All the Possible Customizations are under the worksheet Definition | |||
Team Name | Name of the Team | ||
Commitment Reliability | Can Customize the color-coding Range for Red, Amber, and Green. By defining the From and to % for each color | ||
Velocity Fluctuation | The upper limit and lower limit Percentage from the average velocity | ||
Defect Leakage | Can Customize the color-coding Range for Red, Amber, and Green. By defining the From and to % for each color | ||
Data Capture
| Sprint Data needs to be captured under the Sprint Trend Data worksheet and PB Groom History worksheet. The Graph will automatically pick the last 6 sprint information. It is capable to capture 30 Sprints, after that you can simply clean the past information. | |||
| Information needed to capture to get all the metrics populated – Under Sprint Trend Date | |||
| 1 | Sprint | ||
| 2 | Committed Story Points | ||
| 3 | Accepted Story Points | ||
| 4 | Added Story Points | ||
| 5 | Descoped Story Points | ||
| 6 | Available Capacity (Day 1) | ||
| 7 | Estimated Hours | ||
| 8 | Actual Hours | ||
| 9 | Defects Captured during Sprint | ||
| 10 | Defects Captured After Sprint or PO verification | ||
| 11 | Defects Captured After Sprint or PO verification | ||
| Information needed to capture to get all the metrics populated – Under Backlog Grooming | |||
| 1 | Date of Capture | ||
| 2 | Story Points available for future sprint | ||
Dashboard worksheet Reference
| Dashboard | 8 Metrics, 6 Sprint Trend | |
| Any One Sprint Dashboard | 7 Metrics of specific sprint as per selection | |
| Commitment Reliability | 6 Speedometer an 1 Trend | |
| Capacity Utilization | 6 Cylindrical Column Trend | |
| Velocity | 6 sprint velocity trend, and 6 sprint velocity fluctuation | |
| Defect Leakage | 6 Speedometer an 1 Trend | |
| Estimation Variance | 6 Sprint Estimation variance trend | |
Limitations
Max : Sprint Count in Trend : 6
Watch the video tutorial to know how it works. The Video Tutorial is to target the version 1 only
Note :1. Change Worksheet Zoom to adjust the visible area, based on your screen resolution
2. If the Speedometer border is not sync with the Graph Use the Other Excel Sheet Suffix with NSC (No Speedometer Circle)
Please Note: If you are using Office 2010 or the lower version, You may get some formatting issue
FAQ
Q1. Is this Template work in Google Sheets?
Ans. We have not tested it. We believe as this template are using complex formulas and formats. It may create problems in google sheets
Q2. Can we increase the number of sprints?
Ans. Yes If you are good at Excel, you can. You will get an unprotected sheet where you can make any changes. if you want us to do the changes for you, you can request us, we may do it with a minimal charge.
Video Tutorial
Download Brochure
Gallery


